MATLAB
SDR Data Manipulation
In order to understand the structure of the data that the SDR sends and how to manipulate it, signals were captured in the FM band and stored in a .dat file for manipulation in MATLAB. The RTL-SDR v3 sends 8 bits of I data and 8 bits of unsigned data sequentially. Using this knowledge of the data format and the tuning of the SDR, and sampling rate, the FFT was performed within MATLAB.
Windowing
The FFT assumes continuity of the signal it is being performed on; in other words, it treats the N samples as if they contain a perfectly even number of cycles. Since this is often not the case in reality, spectral leakage becomes an issue. For this project, spectral leakage poses a threat as the IMD products are already naturally close to the fundamental signals. For that reason, windowing is implemented. Windowing is nothing more than a kind of envelope that pinches the ends of the sample data towards 0, which ultimately reduces the presence of smearing but also loses granularity in terms of frequency accuracy. Several different windowing functions were tested in MATLAB.
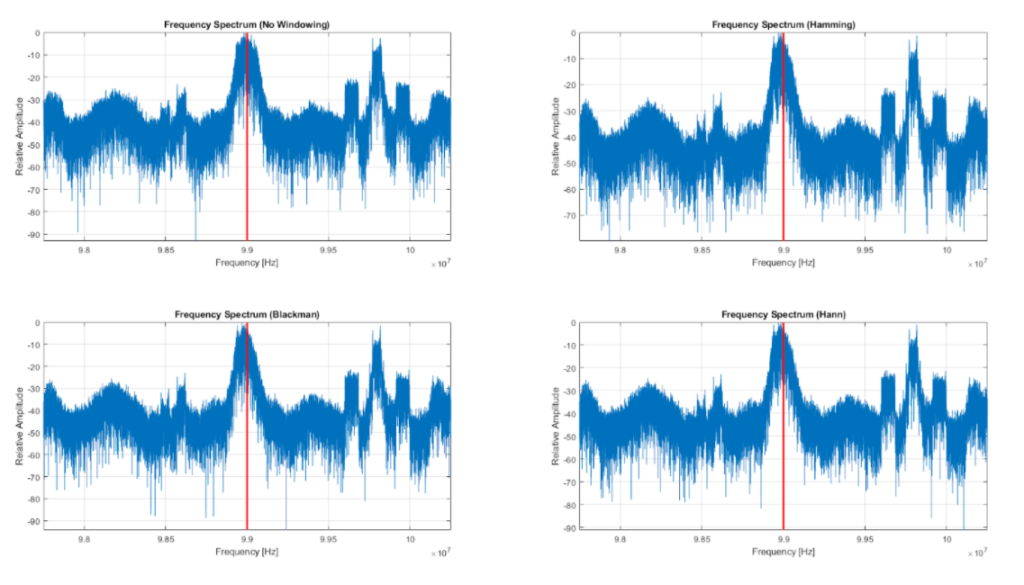
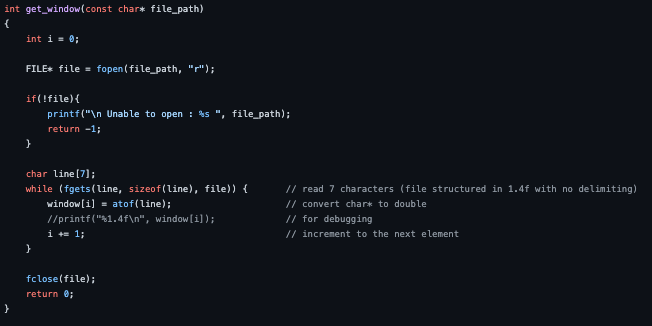
The FM data is not a great example for the effects of windowing, but they are still present. The primary purpose of the usage of MATLAB here was to generate text files of the windowing function that the C code later can read and select from a variety of functions to observe which provides the best results.
Peak Detection Algorithm
The goal of the project requires the identification of peaks in the frequency spectrum. Visually this is a very simple task, but programmatically requires some thought. MATLAB contains functions in toolboxes that can be called to aid in this but since the goal is to port to C, a custom lightweight algorithm was developed instead.
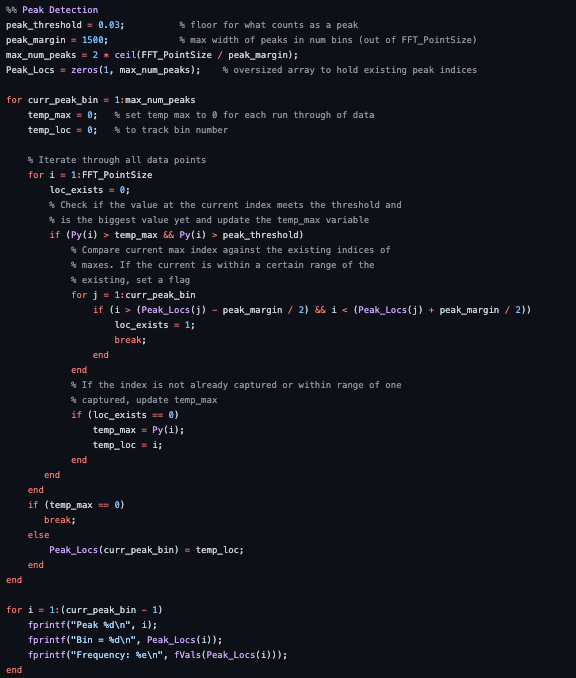
The algorithm is most likely far from ideal, but for now is a functional option. The loop simply sweeps across the frequency bins looking for indices that contain a max that has not yet been found. It also defines a minimum margin between peaks, meaning that if a peak is found at 5 kHz, there is a range around that were data is discarded. This needs to be wisely chosen based on how the data is expecting to be.
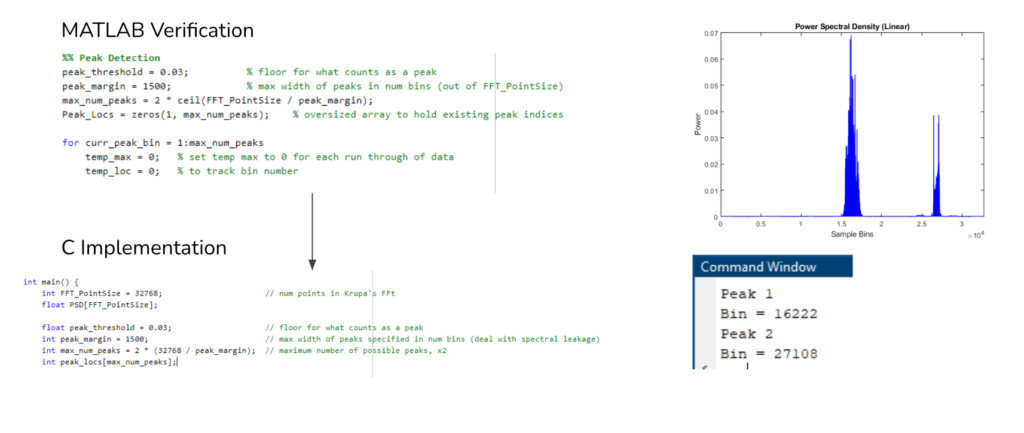
The MATLAB code was then written in C after verification.
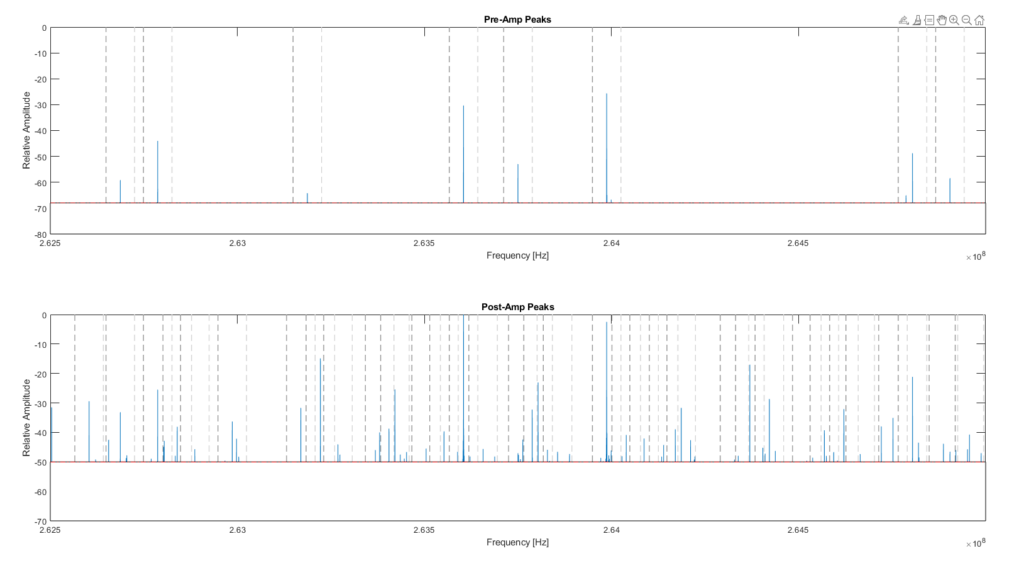
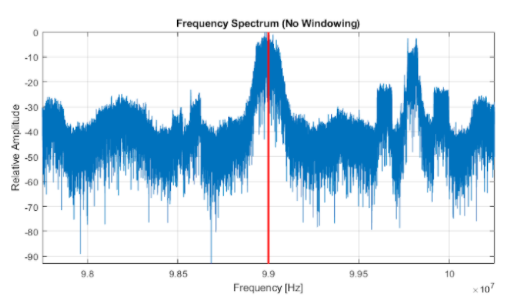
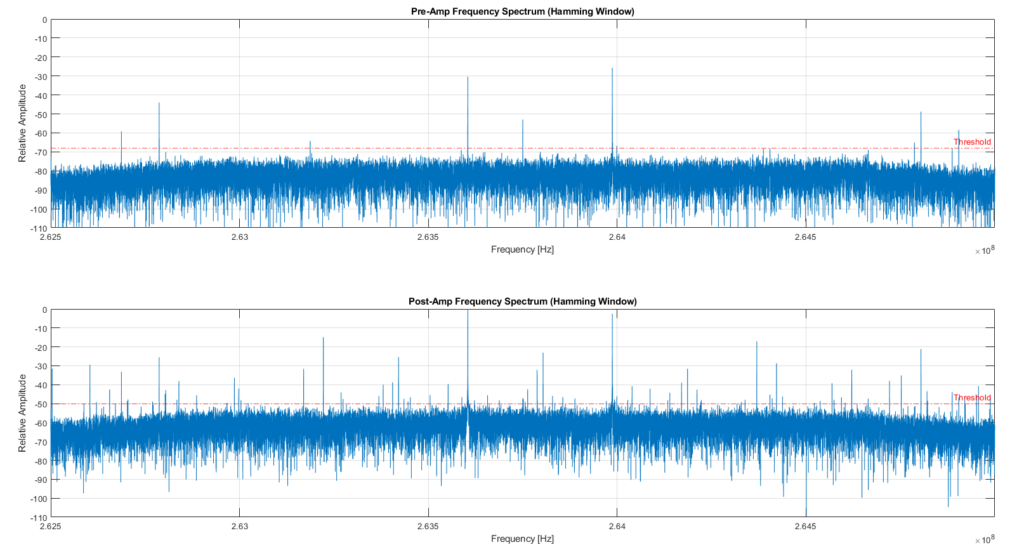
The above figure visualizes the peak detection algorithm. A dark line denotes a left margin and light gray line denotes a right margin. Each pair when moving from left to right has a peak in the middle. A benefit of the algorithm is that it inherently stores signals in order of magnitude, which simplifies future comparisons. The above visualization hides data beneath the noise floor. The full signal is shown below.
Data Transfer Implementation
SDR – Raspberry Pi Communication
The first task of the software implementation was to find a means to transfer SDR data to the GPIO pins. After investigating the underlying code in open-source SDR software such as GQRX or GNU-Radio, it was determined that the most lightweight option was to use the librtlsdr library. The library offers several terminal commands to tune the SDR and capture data to a file. Details on that can be found on the Github page or here. The primary command to be used is rtl_sdr, which can write live SDR data to a file. A less used advertised of the command however, is that it can dump that same data to stdout continuously. Using this functionality the stdout of the rtl_sdr command is piped to a C program that stores 65k* bytes of data in a buffer to be sent to the FPGA. Recall that the FFT size specified is 32k* points; the 65k number comes from the fact that the SDR sends 1 byte of I data and 1 byte of Q data sequentially, so one sample is really 2 bytes. This needs to be instantiated for both SDRs with their specific GPIO pins.

*32k and 65k are used interchangeably for 32,768 and 65,536.
Pi – FPGA Communication
The main_control program mentioned above is what interfaces with the Pi’s GPIO and therefore the FPGA.
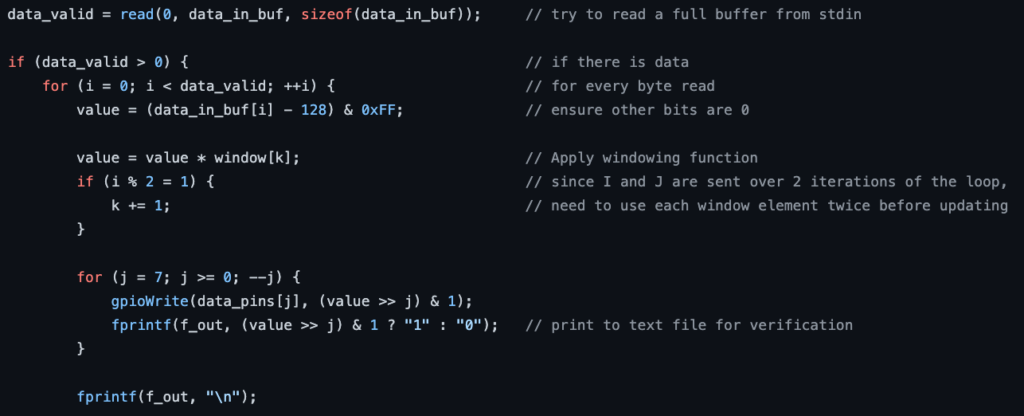
The above code snippet shows how code is read into the buffer and processed. Once the GPIO pins are updated, the handshaking scheme discussed in the preliminary design page is implemented.
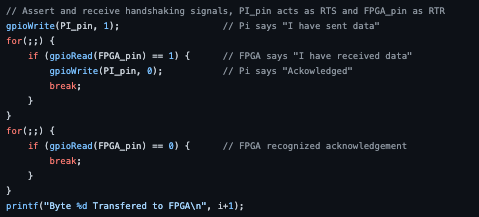
For the sending portion of the Pi’s code, the Pi asserts high and then waits indefinitely until it reads a response from the FPGA and asserts a low signal to indicate the reception. Finally when the FPGA responds, the loop breaks and starts over with new data. The print statement was simply for debugging purposes but will not be present in final implementation to improve speed. In order to verify the functionality of the interface, the Pi writes all data that it sends to a text file and all data it receives to a text file. For this, the FPGA must simply store all the data in a BRAM and then send it all back untouched.
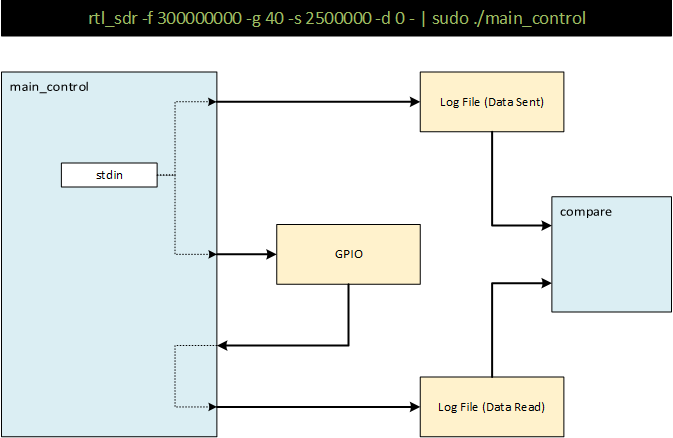
The above diagram illustrates the testing procedure for data integrity.