Design Input Addressed:The device must be comfortable for the patient.
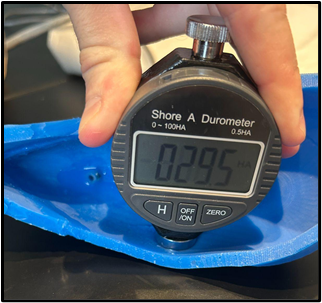
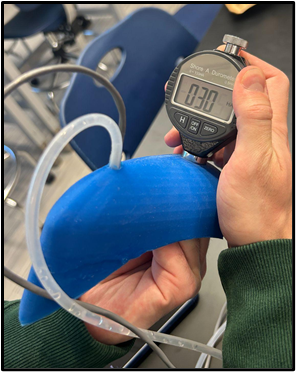
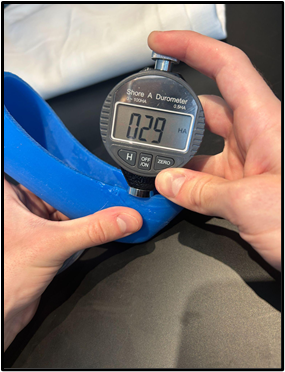
Verification Activity: Material hardness test on the urine collection cup. (Shore A Hardness of 30 ± 1.0)
Acceptance Criteria: ≥ 90% accuracy → PASS
Statistical Analysis: Run two, one sample t-tests for each position on the cup, and compare to 30 ± 1.0 with a confidence interval of 95%.
Inner Side
Center Back
Edge
N
10
10
10
Average
30.25 ± 0.677
29.85 ± 0.669
30.15 ± 0.626
P-value (29)
1.24×10⁻⁴
1.51×10⁻³
1.28×10⁻⁴
P-value (31)
3.34×10⁻³
1.00×10⁻³
2.06×10⁻⁴
Pass/Fail
Pass
Pass
Pass
Verification results for Design Input 1.
Volume Verification
Design Input Addressed:The device must collect an acceptable urine sample volume.
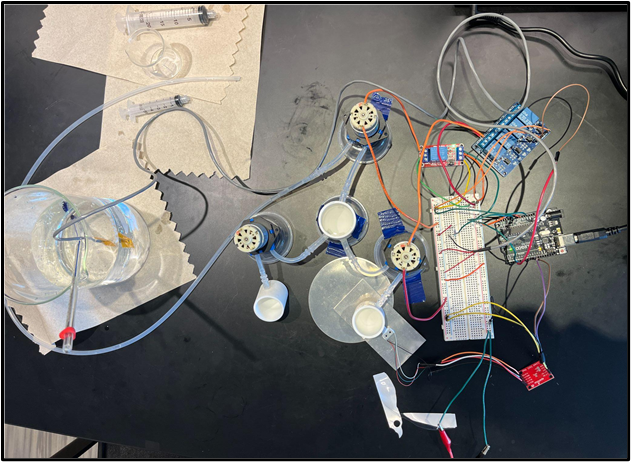
Verification Activity: Run first peristaltic pump to collect a volume ≥ 2.0 mL.
Acceptance Criteria: Collected volume ≥ 2.0 mL with 95% accuracy → PASS
Statistical Analysis: Run one sample t-test, compare to 10 mL necessary to complete testing where α = 0.05 and a C.I. of 95%.
N
10
Average
14.78 ± 0.249
P-value
<0.0001
Pass/Fail
Pass
Verification results for Design Input 2.
Biomarker Detection Accuracy
Design Input Addressed:The device must be able to detect the presence of bioburden associated with UTIs.
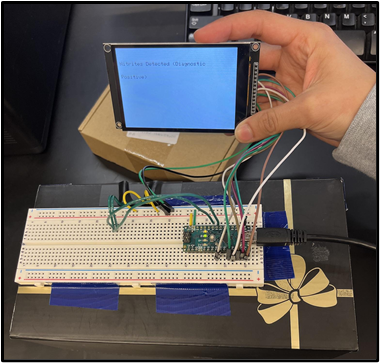
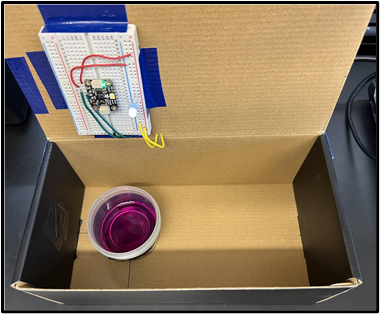
Verification Activity: Using prepared urine samples with known nitrite and leukocyte concentrations, a colorimetric sensor measures dye intensity resulting from the Griess reaction (nitrites) and a two-step chemical reaction (leukocyte esterase), with sensor readings compared to spectrophotometer results.
Acceptance Criteria: ≥ 95% accuracy across trials → PASS
Statistical Analysis: Run McNemar’s test based on the varying concentrations, compare to α = 0.01.
N
15
P-value
1.0
Accuracy
40%
Pass/Fail
Fail
Verification testing results for Nitrites for Design Input 3.
N
15
P-value
0.014
Accuracy
60%
Pass/Fail
Fail
Verification testing results for Leukocytes for Design Input 3.
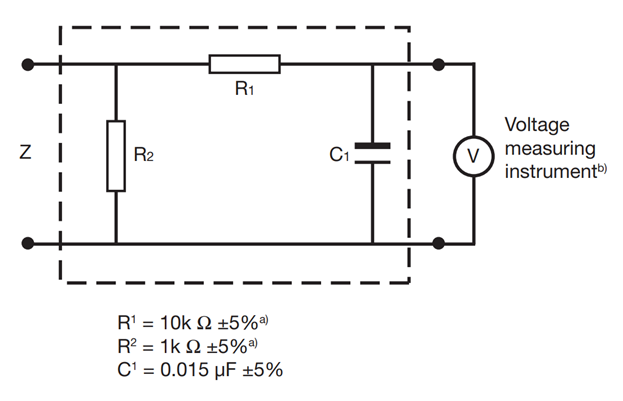
Verification Activity: Run the device and measure leakage current using a digital multimeter to confirm compliance with IEC 60601-1 standards.
Acceptance Criteria: ≤ 500 μA → PASS
Statistical Analysis: Run one sample t-test, compare to 500 μA where α = 0.05 and a C.I. of 95%.
N
10
Average
24 ± 5.16 μA
P-value
<0.0001
Pass/Fail
Pass
Verification testing results for Design Input 6.
Sanitization Effectiveness
Design Input Addressed:The device must be sanitizable.
Verification Activity: Run a cleaning sequence after a positive sample, then test with a negative sample to confirm no residual contamination.
Acceptance Criteria: ≥ 95% accuracy across trials → PASS
Statistical Analysis: Run McNemar’s test based on two possible outcomes: Positive or Negative, compare to α = 0.05.
N
20
P-value
0.0117
Accuracy
95%
Pass/Fail
Pass
Verification testing results for Design Input 7.
ValidationTesting
Below are the completed validation studies.
Comfortability
Design Input Addressed:The device must be comfortable for the patient.
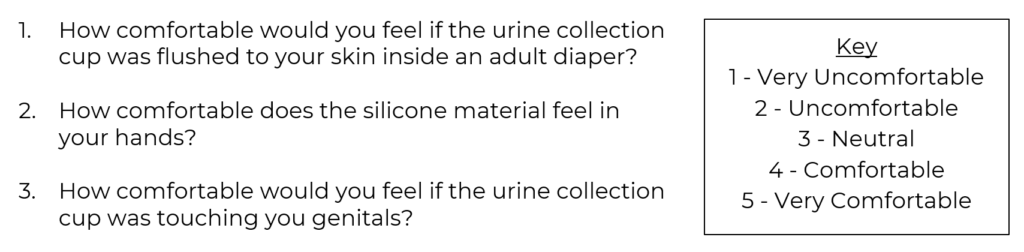
Validation Activity: Survey a group of subjects to test for comfortability based on a 1-5 scale.
Statistical Analysis: A non-parametric sign test was conducted to assess whether the subjects’ responses were significantly greater than the acceptance score of a 3 with a C.I. of 95%.
Comfort with cup flushed to skin
Comfort with silicone in hands
Comfort with touching genitals
N
20
20
20
Average
4.25 ± 0.55
5.00 ± 0.00
4.00 ± 0.65
P-value
< 0.0001
< 0.0001
< 0.0001
Pass/Fail
Pass
Pass
Pass
Validation results for Design Input 1.
Volume Validation
Design Input Addressed:The device must collect an acceptable urine sample volume.
Validation Activity: Run a sample collection experiment with the load cell and pump with 95% sample collection accuracy.
Statistical Analysis: Run one sample t-test, compare to 5 mL necessary to complete reach testing where α = 0.05 and a C.I. of 95%.
Load Cell 1
Load Cell 2
N
10
10
Average
5.24± 0.19
5.19± 0.19
P-value
0.01676
0.01174
Pass/Fail
Pass
Pass
Validation results for Design Input 2.
Biomarker Detection Accuracy
Design Input Addressed:The device must be able to detect the presence of bioburden associated with UTIs.
Validation Activity: Run urinalysis test with positive and negative samples with 95% accuracy.
Statistical Analysis: Run McNemar’s test based on two possible outcomes: Positive or Negative, compare to α = 0.01.
N
20
P-value
1
Accuracy
70%
Pass/Fail
Fail
Validation testing results for Nitrites for Design Input 3.
N
20
P-value
0.0832
Accuracy
85%
Pass/Fail
Fail
Validation testing results for Leukocytes for Design Input 3.
Communication of Results
Design Input Addressed:The device must communicate the levels of bioburden detected in the urine sample.
Validation Activity: Create positive, caution, and negative samples to test if the results displayed correlate with the level of bacteria detected.
Statistical Analysis: Run Chi-Square test based on three possible outcomes: Positive, Caution, and Negative, compare to α = 0.01.
N
20
P-value
<0.001
Accuracy
80%
Pass/Fail
Fail
Validation testing results for Design Input 4.
Timing
Design Input Addressed:The device must be able to provide results in a clinically relevant amount of time.
Validation Activity: Run full testing sequence and time it.
Statistical Analysis: Run one sample t-test, compared to 900 seconds (15 minutes) where α = 0.05 and a C.I. of 95%.
N
20
Average
183.7± 1.49
P-value
<0.0001
Pass/Fail
Pass
Validation testing results for Design Input 5.
Waste Disposal
Design Input Addressed:The device must be sanitizable.
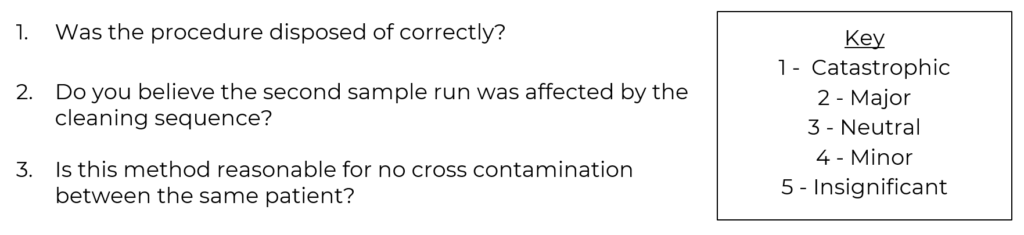
Validation Activity: Survey subjects on observed cleaning sequence and subsequent trial run on a scale of 1-5.
Statistical Analysis: A non-parametric sign test was conducted to assess whether the subjects’ responses were significantly greater than the acceptance score of a 4 with a C.I. of 99%.