
Echo Testing Results
One of our main goals was to complete some echo tests with LoRa. The captured waveform from our first echo tests is shown below in Figure 1. One of the difficulties of echo testing is that we can only capture 2.5 seconds of the incoming message which is why there is only a small portion of the up-chirp being captured. The waveform that is shown below in Figure 1 is using a BW of 375 Hz and a SF of 12
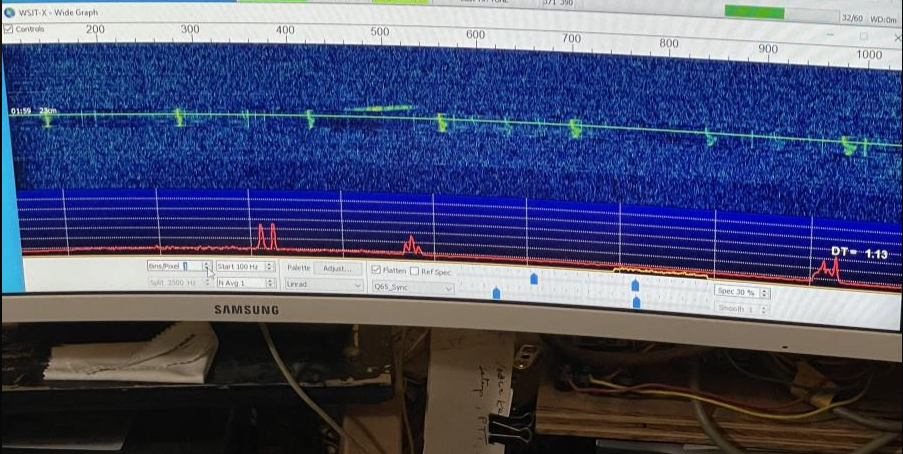
Figure 1: Received Echo Waveform
We were also during one transmission able to successfully demodulate the intended text message, “NJ”. This transmission was performed at a bandwidth of 1500 Hz with a spreading factor of 7. We were only able to achieve this once and with no consistency. Figure 2 shows the received messages, the first one having no errors. The other two show the intended message embedded in some unwanted characters. Nevertheless, the intended message was still present in the other two received and demodulated signals. If given more time to test, attempting to make this successful transmission consistent given what parameters we know could’ve been another stretch goal. This was, however, a good precursor to our further attempts at one way communication.
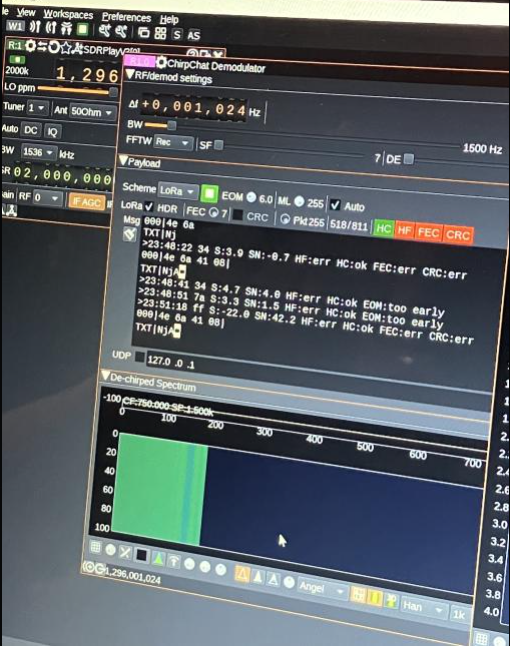
Figure 2: Demodulated Message
One Way Communication Results
Our main goal for this semester was to send a LoRa modulated signal from New Jersey to Alaska via EME propagation, we were successful in sending and receiving the signal, but were not successful in demodulating the message. As previously mentioned, the structure of LoRa signals makes decoding them extremely sensitive to synchronization errors . The waveform shown below in Figure 3 is the received signal with a bandwidth of 3125 Hz and a spreading factor of 10, and the waveform shown in Figure 4 that is significantly less clear has a bandwidth of 5208 Hz and a spreading factor of 10. Comparing these waveforms is a great way to see just how much spreading factor and bandwidth can affect a message’s strength with EME Propagation. The only thing in our setup that was changed between these transmissions during testing was the power source that was used for transmitting in NJ, and that should not have created the severe decrease in power that we see in Figure 4.
All of the recordings from our EME sessions can be seen on Mike’s website which is linked below.
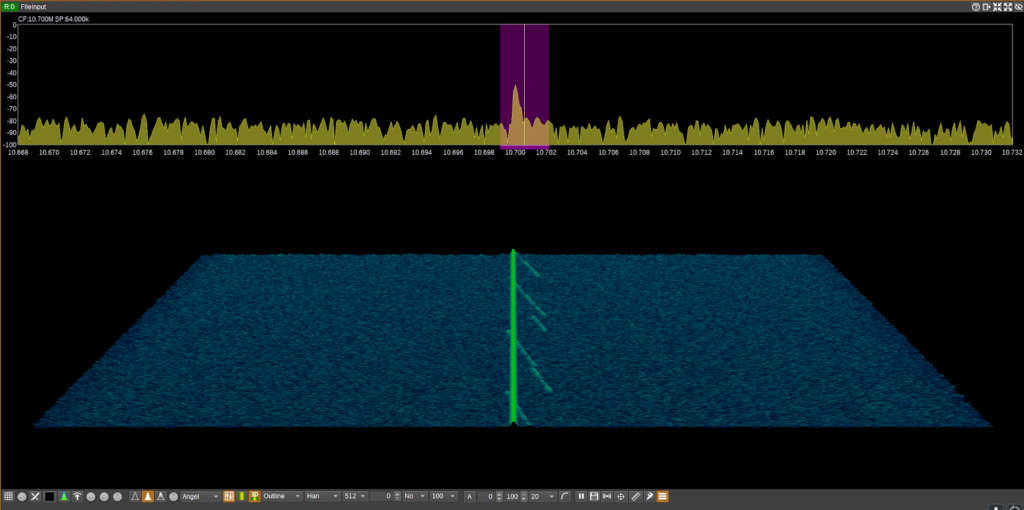
Figure 3: Received Signal with Bandwidth of 3125 Hz
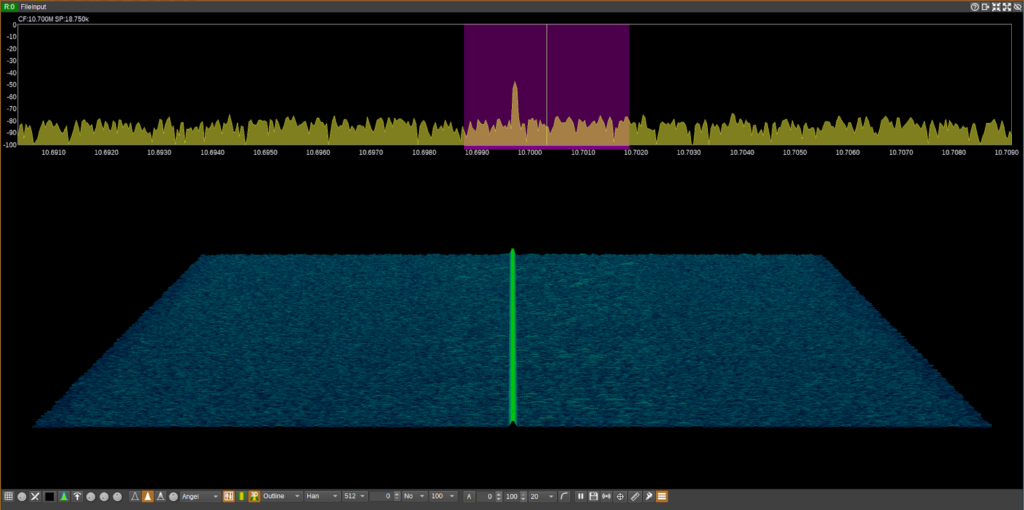
Figure 4: Received Signal with Bandwidth of 5208 Hz