
Electric Heating Pads:
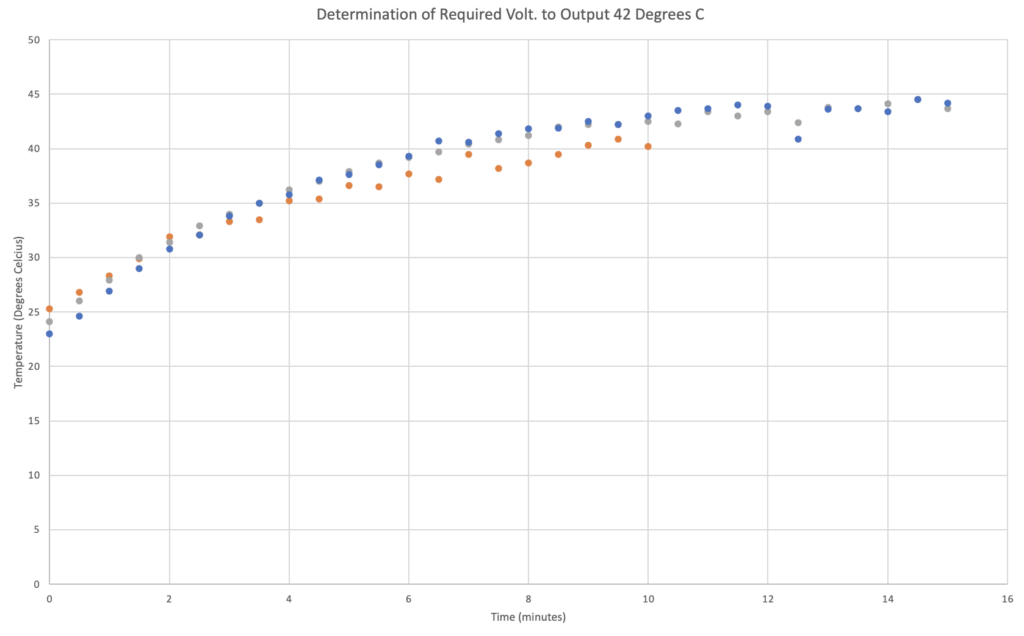
Figure 1: Plot of Temperatures at Voltages of 4 (Orange), 4.06 (Green), and 4.15 (Blue). It was determined that a voltage of 4.06 was optimal, and this value was used to define relationships for the remaining heating temperatures as well as cooling.
Thermistors:
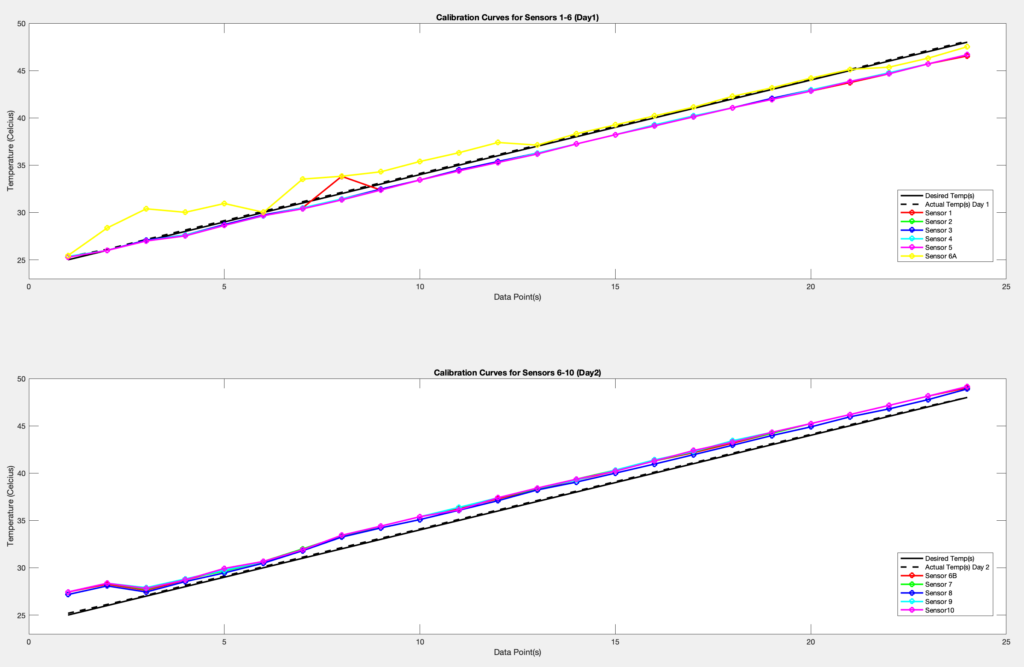
Figure 2: Calibration curves for ten 10k Epoxy Coated Thermistors. Ultimately, four sensors were designated for heating based on R-squared values. The equations for the selected thermistors were found separately and adjusted to fit the desired temperatures line. All adjustments were made within the code for the device.
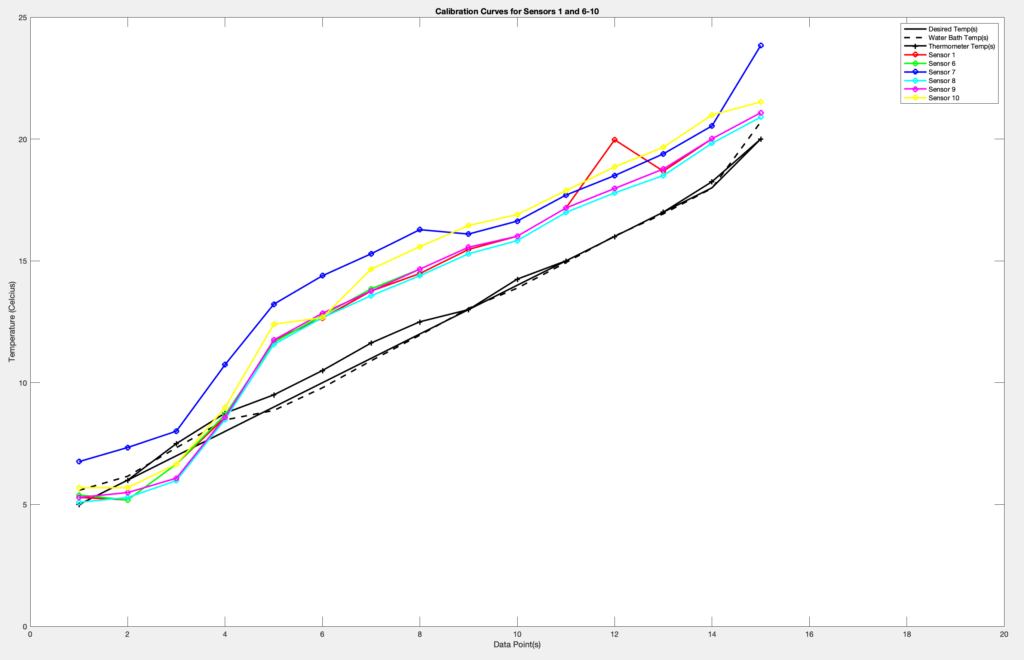
Figure 3: Calibration curves for seven 10k Epoxy Coated Thermistors. Similar to before, four sensors were designated for cooling based on R-squared values and the equations for these sensors were adjusted within the main code.