Monthly Archives: March 2016

Estimated Peak Flow and Hydrograph

peak flowhydrograph

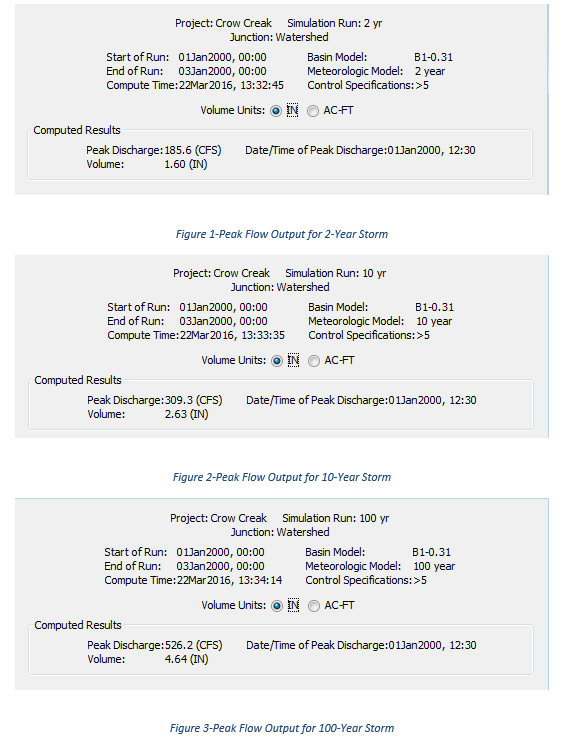
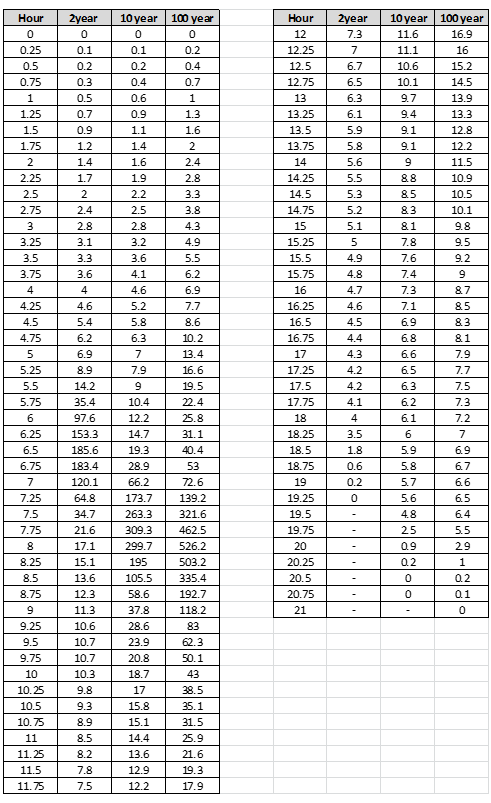
Using the hydrologic model from HEC-HMS 4.1 and the Curve Number method, 15 minutes increment hydrographs and peak flow values were generated for the 2-year, 10-year and 100-year return period. The excess volume during a 100-year storm event constrained the overall volume of the basin. In addition, the peak flows from the three return periods also determined the design of the outlet structure. After multiple simulation runs from the program VTPHSUM, a three-steps concrete rectangular weir was selected for the design.

weir

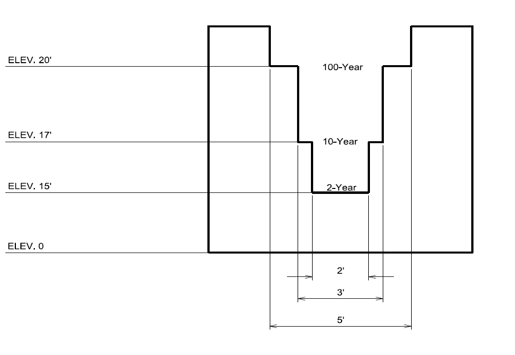
The rectangular weir model above showed the overall dimension of the structure. The weir consisted of three steps at different width and elevation which would allow the outlet structure to release water at different flow rate in accordance to the storm event. The ability to release an adequate amount of water would prevent the basin from overflow when its storage capacity exceeded.


Retention Basin Design

basin

Figure 1: Basin Layout

The retention basin in this design consisted of two parts: the permanent pool and the control pool as showed in Figure 1. The permanent pool will serve as a sustainable habitat for the future fish and wild life population. The water in the permanent pool is expected to maintain a constant depth of at least 15 ft. year round. The depth of the permanent pool was designed so that the fish population can continue living in their habitat even when the basin’s surface gets frozen over the winter months. The control pool will serve as temporary water storage during a storm event thus preventing the runoff from flooding the area. The water in the control pool will be released through an outlet structure into an appropriate culvert. The volume of runoff associated with a 100-year storm will determine the overall dimension of the control pool.