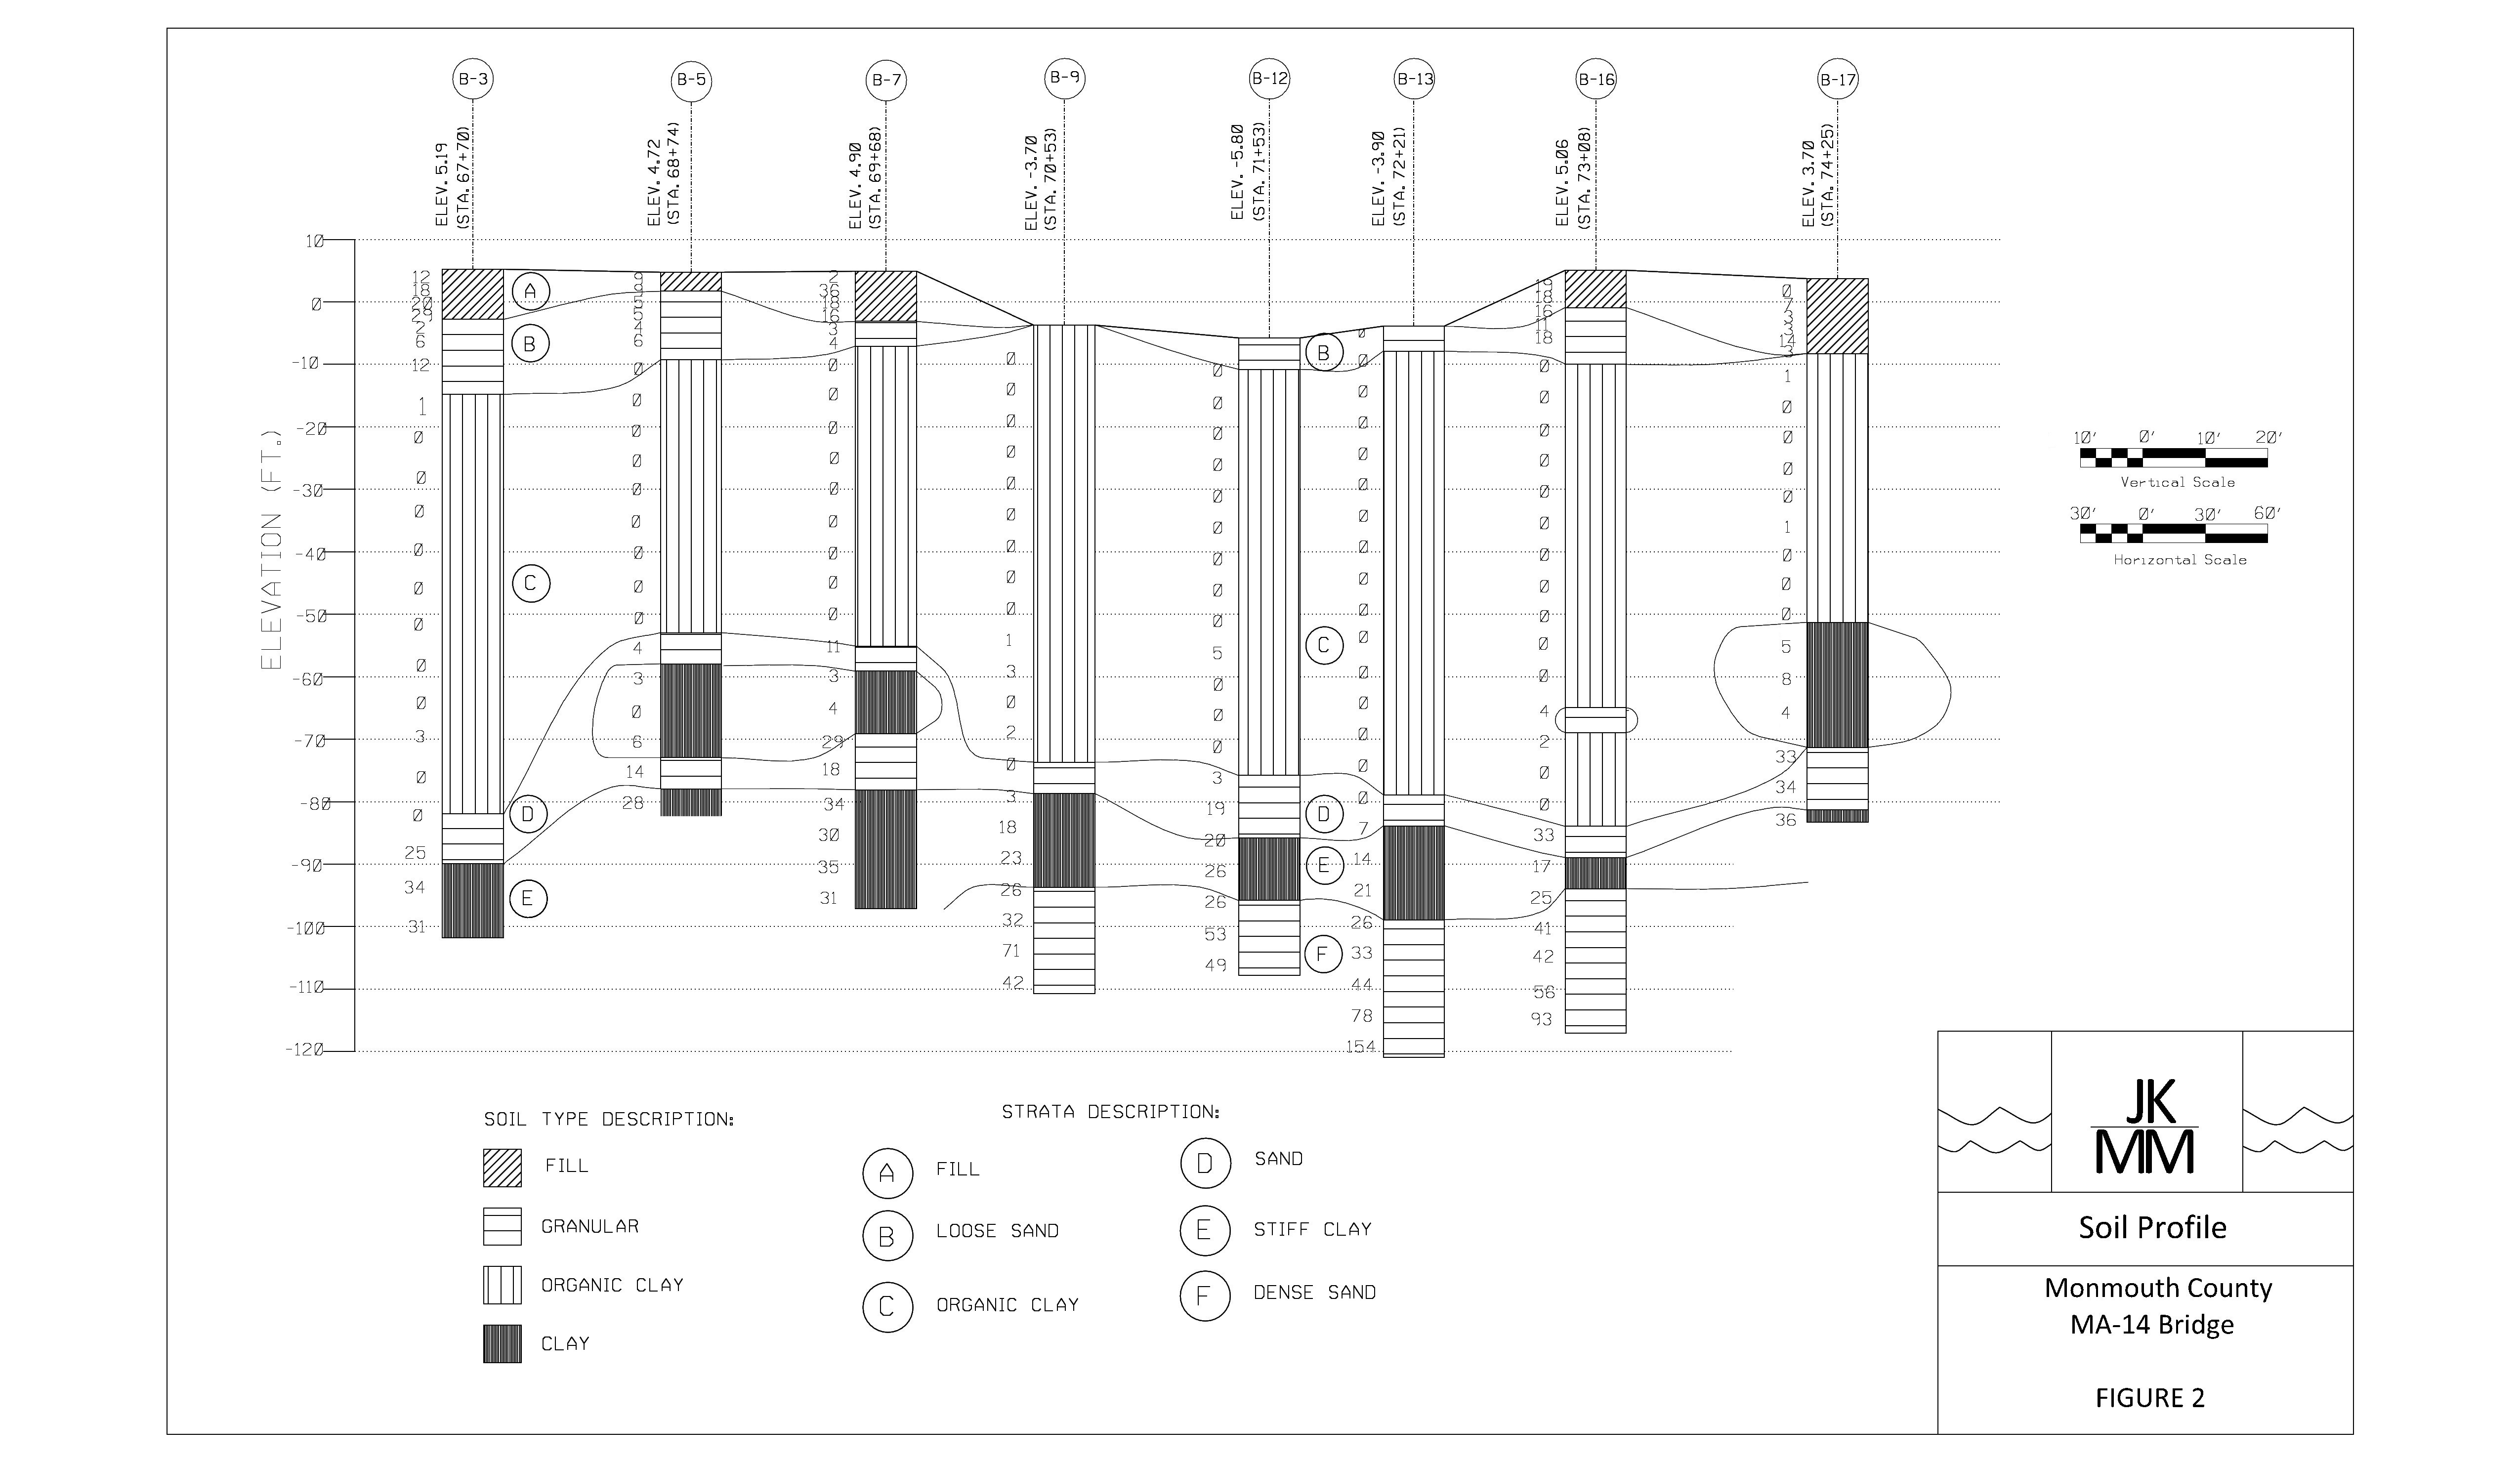
After determining the soil profile, soil properties for each stratum were calculated. For the cohesive layers (C and E), laboratory test results for unit weight, compression ratio, recompression ratio, pre-consolidated stress, and cohesion provided by TerraSense were averaged. For the granular layers (A,B,D,F), the unit weight, angle of friction, bearing capacity, and compression ratio were calculated by empirical graphs using the average SPT value for each individual layer.
|
Stratum |
Unit Weight (pcf) | Angle of Friction (degrees) |
C’ |
CR |
RR |
Pre-Consolidated Stress (ksf) |
Cohesion (ksf) |
| A | 110 | 33 | 68 | 0.014 | |||
| B | 100.00 | 31 | 46 | 0.022 | |||
| C | 93.82 | 0.287 | 0.03 | 1.6-4.0 | 0.46 | ||
| D | 120 | 33 | 55 | 0.018 | |||
| E | 119.5 | 0.119 | 0.03 | 21.8 | 1.76 | ||
| F | 130 | 39 | 95 | 0.011 |